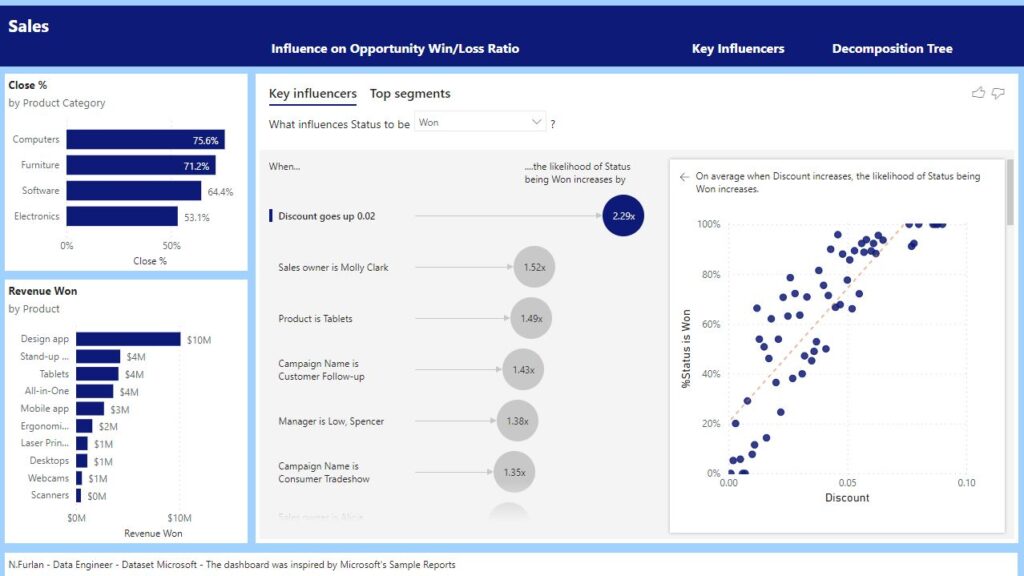
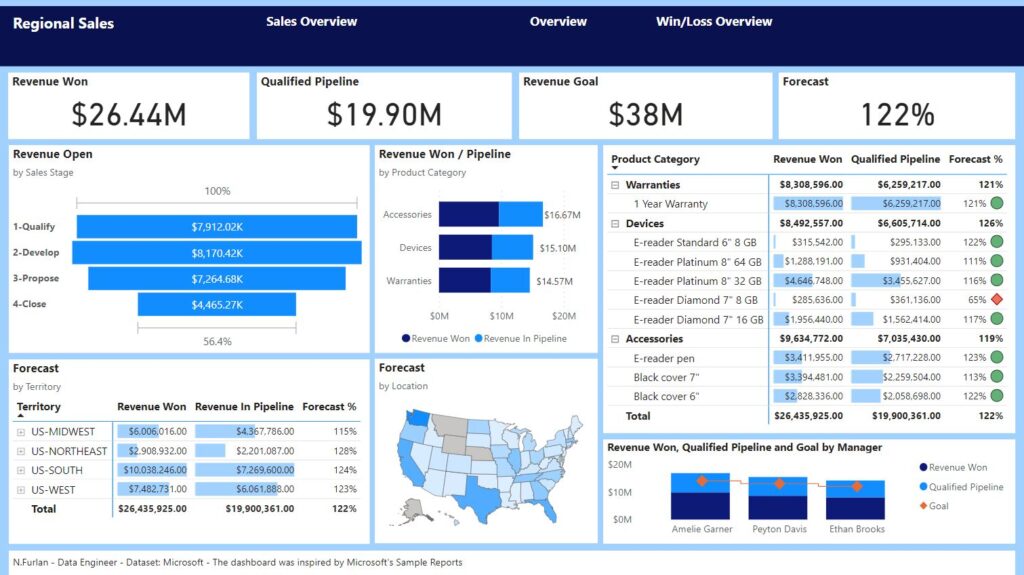
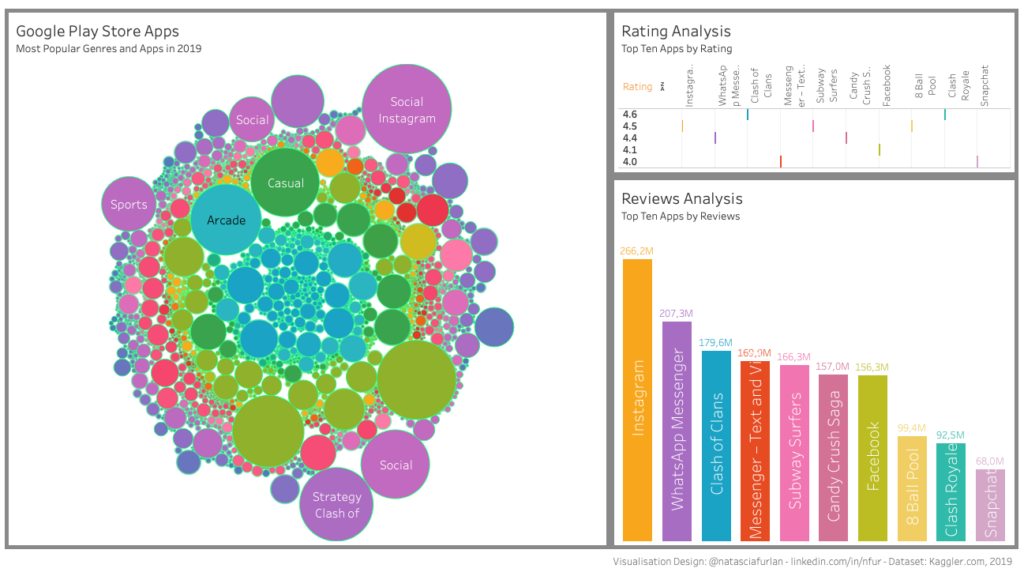
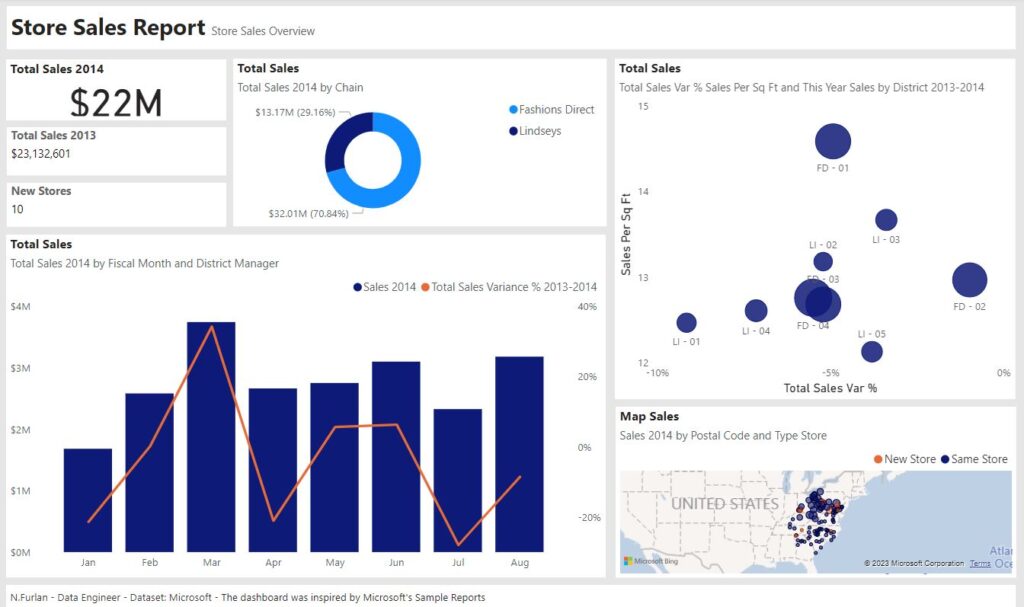
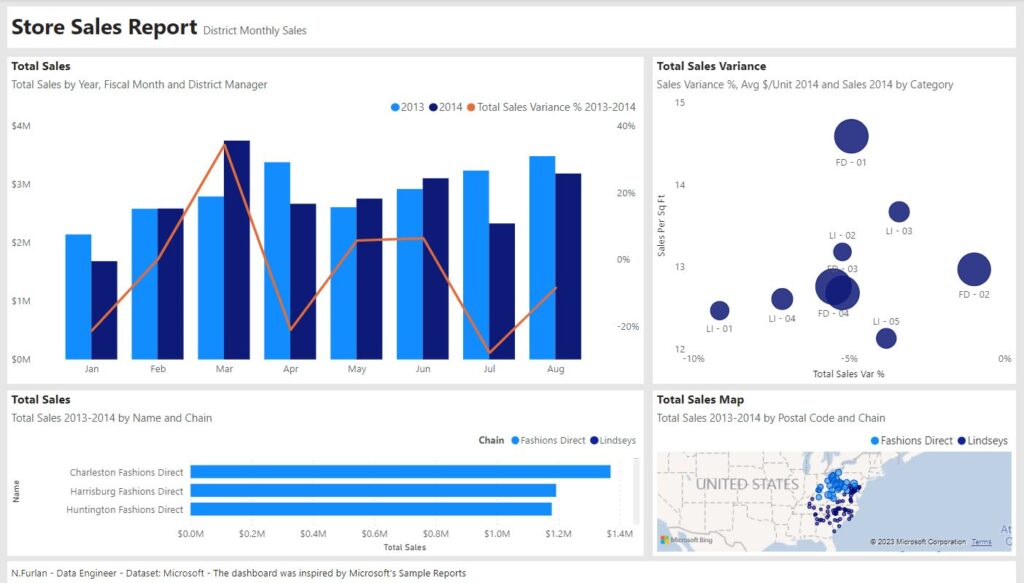
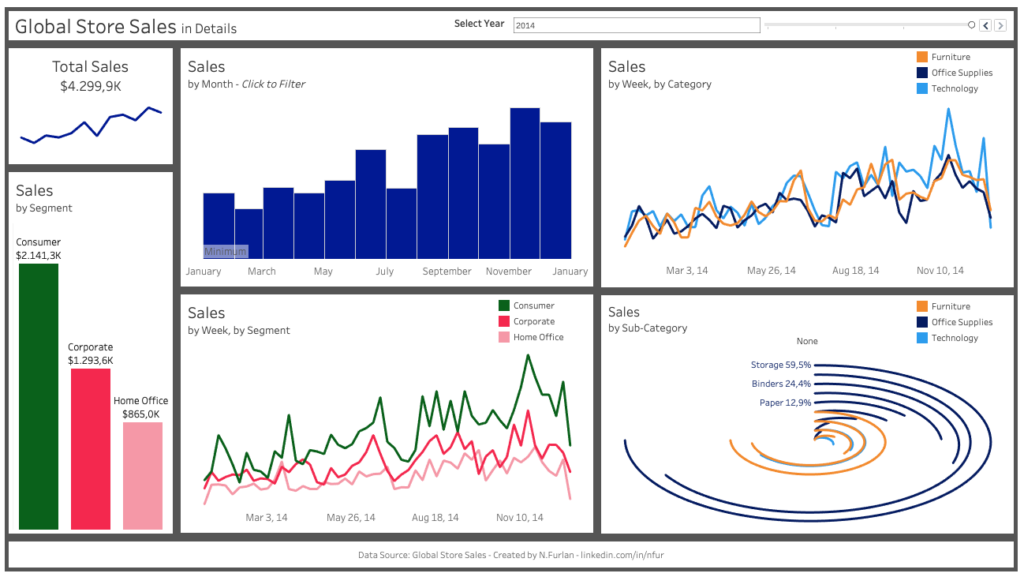
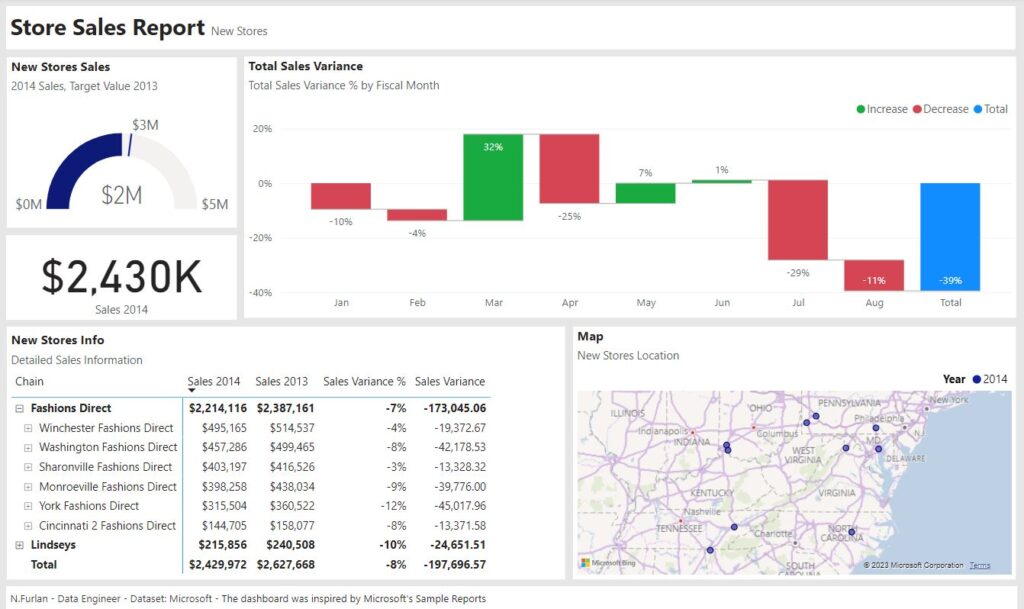
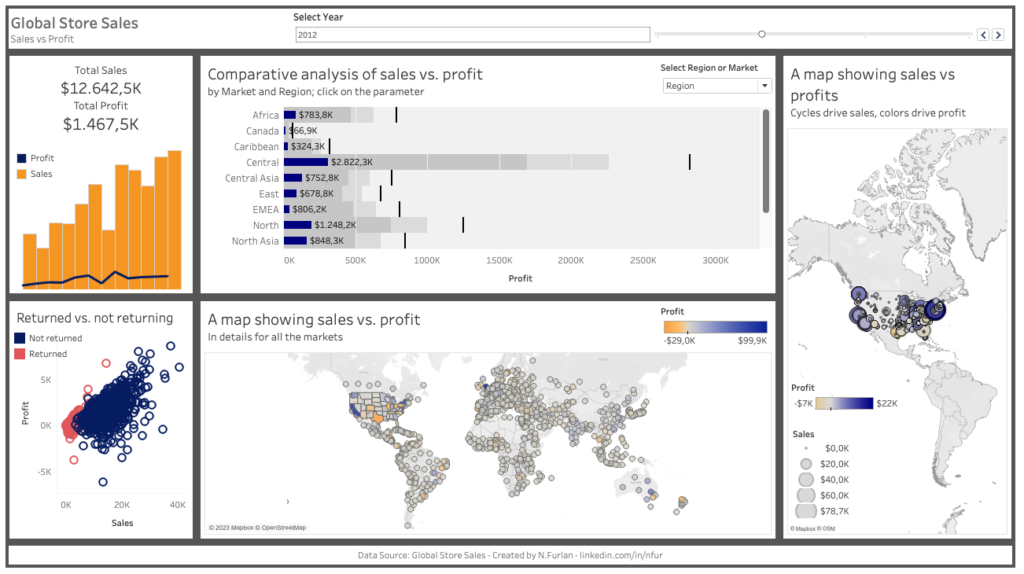
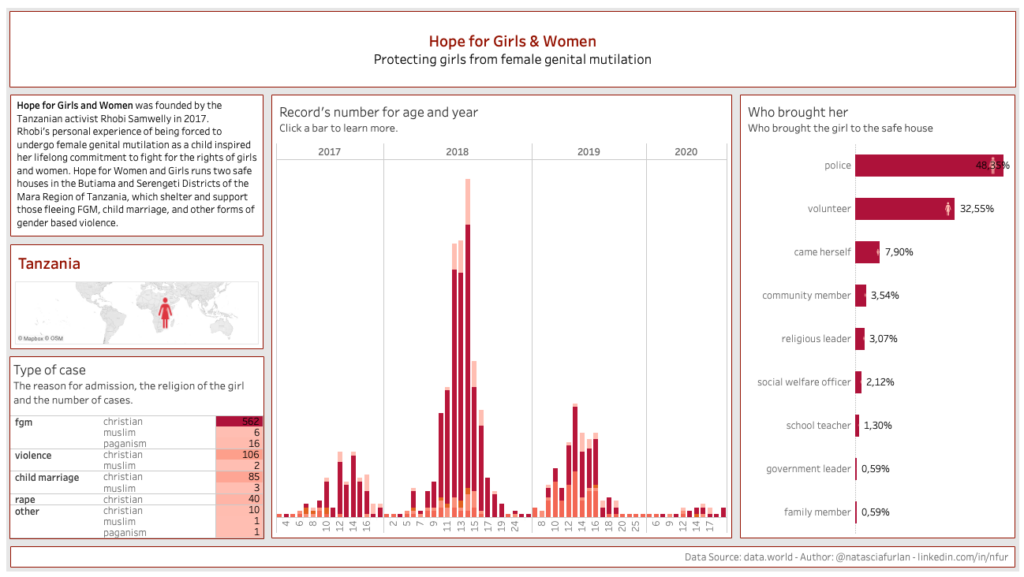
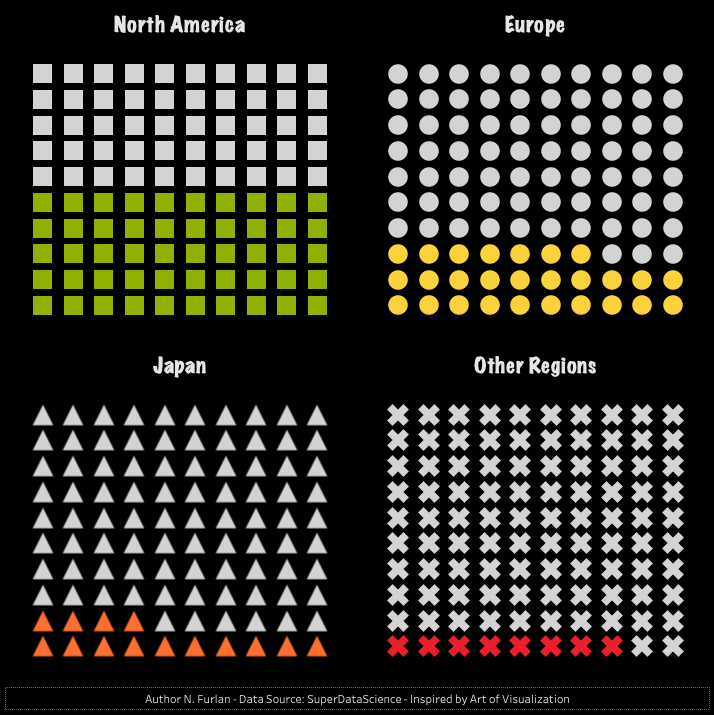
Data Analysis Dashboards: Visual Insights Presented in Pictures
Welcome to my dashboard gallery, where I showcase a collection of interactive data visualisations crafted using Tableau and Power BI. These dashboards provide key insights and deep analysis across various datasets. Explore the visual stories that turn complex data into actionable insights.